

What Does a Concept Map Look Like? The AI-Powered Guide to Visualizing Knowledge
 ·7/2/2026·9 min read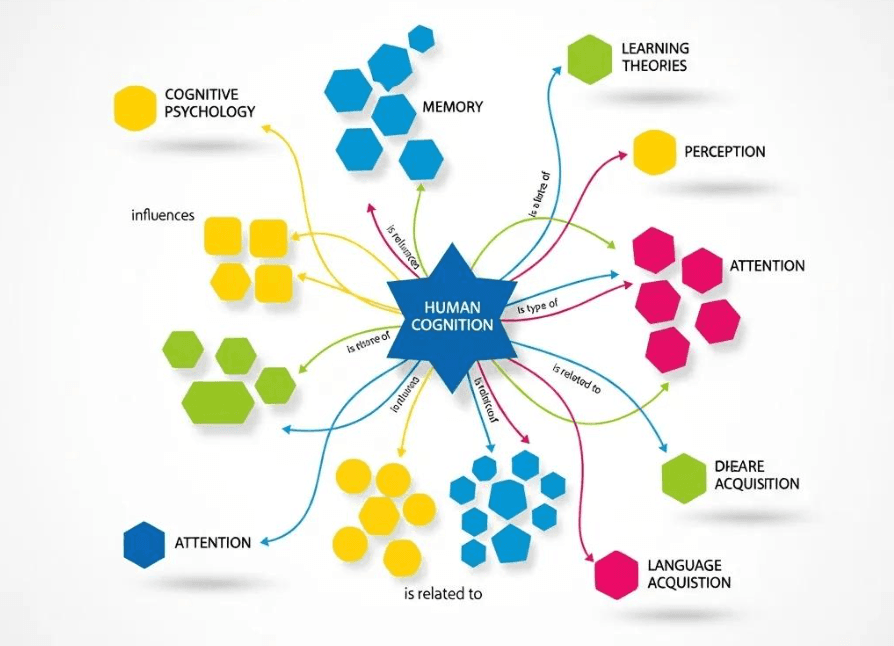
Concept maps are powerful tools for visualizing knowledge, allowing individuals to organize and represent information in a structured manner. This guide will explore the essential components of concept maps, their various types, and how they can be effectively created using AI tools. Understanding concept maps can significantly enhance your ability to process and retain information, making them invaluable for students, researchers, and professionals alike. In this article, we will delve into the definition of concept maps, their core components, the different types available, and practical applications. Additionally, we will discuss how AI tools can streamline the creation of these maps, compare them to mind maps, and provide real-world examples to illustrate their effectiveness.
Quick answer: A concept map shows connected concepts as nodes and labeled arrows showing relationships. Unlike mind maps (which radiate from one center), concept maps can show complex, multi-directional relationships — with labeled links like "causes," "leads to," or "contradicts." Well-structured concept maps include cross-links between branches, hierarchical levels, and linking words on each arrow. For researchers, Ponder's canvas creates living concept maps: you can link actual documents to each node and query relationships with AI, not just draw static diagrams.
What Is a Concept Map? Definition and Core Components
A concept map is a visual representation of relationships between concepts, typically organized hierarchically. It consists of nodes, which represent concepts, and links that illustrate the relationships between these concepts. The primary benefit of a concept map is its ability to clarify complex information, making it easier to understand and remember. By structuring knowledge visually, concept maps facilitate deeper learning and comprehension.
What Are the Fundamental Elements of a Concept Map?
The fundamental elements of a concept map include:
Nodes: These are the individual concepts or ideas represented in the map. Each node can contain a single word or a phrase that encapsulates the concept.
Links: These are the connecting lines that show the relationships between nodes. Links often include linking words or phrases that explain the nature of the relationship.
Propositions: A proposition is a statement that expresses a relationship between two or more nodes, typically formed by combining nodes and links with linking words or phrases.
These elements work together to create a comprehensive visual representation of knowledge, enhancing understanding and retention.
How Does the Hierarchical Structure and Cross-Links Organize Concepts?
The hierarchical structure of a concept map organizes concepts from general to specific, allowing users to see the broader context before diving into details. This structure is complemented by cross-links, which connect different nodes across the hierarchy, illustrating relationships that may not be immediately apparent. For example, a concept map about ecosystems might have a general node for "Ecosystem" at the top, with specific nodes for "Forest," "Desert," and "Aquatic" below it. Cross-links could connect "Forest" to "Photosynthesis," showing how this process is relevant across different ecosystems.
What Are the Different Types of Concept Maps and Their Uses?
Concept maps come in various types, each serving different purposes and applications. Understanding these types can help you choose the right format for your needs.
How Do Hierarchical, Spider, Flowchart, and System Concept Maps Differ?
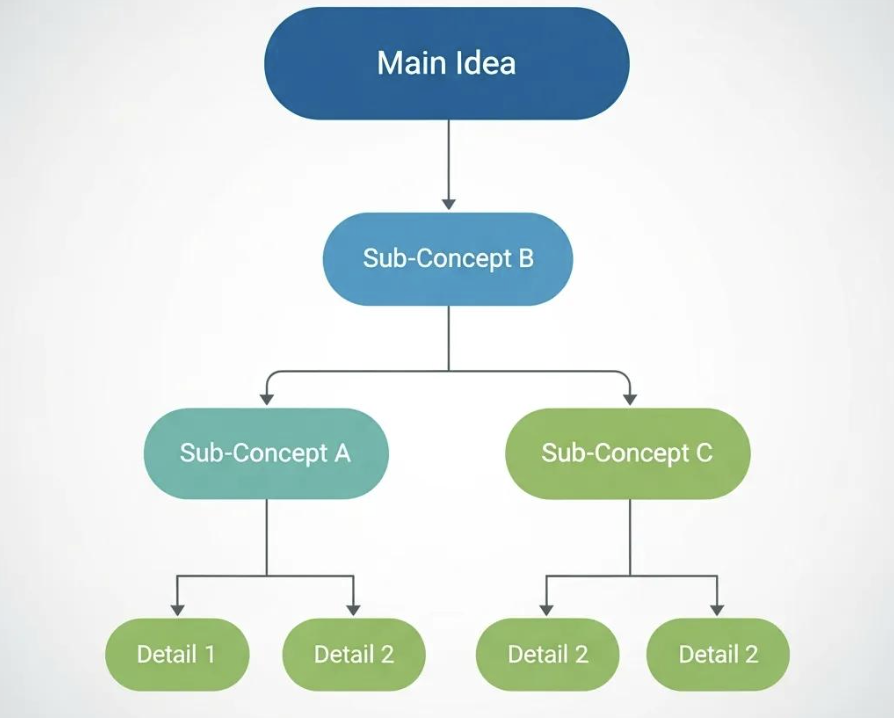
Hierarchical Concept Maps: These maps display information in a top-down structure, starting with the most general concepts at the top and branching out to more specific ideas below.
Spider Concept Maps: These maps radiate from a central concept, with related ideas branching out like a spider's web. This format is useful for brainstorming and exploring a central theme.
Flowchart Concept Maps: These maps illustrate processes or sequences, using arrows to show the flow of information or steps in a procedure. They are ideal for outlining workflows or decision-making processes.
System Concept Maps: These maps represent complex systems with interrelated components, often used in fields like engineering or environmental science to show how different elements interact.
What Are Practical Applications of Each Concept Map Type?
Each type of concept map has unique applications:
Hierarchical Concept Maps: Useful in educational settings for organizing curriculum or study materials.
Spider Concept Maps: Ideal for brainstorming sessions, allowing teams to explore ideas around a central theme.
Flowchart Concept Maps: Commonly used in business to outline processes, such as project management or customer service workflows.
System Concept Maps: Employed in scientific research to illustrate the interactions within ecosystems or mechanical systems.
How to Create a Concept Map: Step-by-Step Guide Using AI Tools
Creating a concept map can be simplified with the help of AI tools, which enhance the process and improve the final product.
What Are the Essential Steps to Build a Concept Map?
Identify the Main Concept: Start by determining the primary idea or topic you want to explore.
Brainstorm Related Concepts: List out all relevant concepts that connect to the main idea.
Organize Hierarchically: Arrange the concepts from general to specific, creating a clear structure.
Draw Links: Connect the concepts with lines, adding linking phrases to clarify relationships.
Refine and Revise: Review the map for clarity and completeness, making adjustments as necessary.
How Does AI Enhance Concept Map Creation and Refinement?
AI concept mapping tools like Ponder can significantly enhance the concept mapping process by providing suggestions for connections, automating organization, and improving user experience. These tools analyze the relationships between concepts and offer insights on how to best structure the map. Additionally, they can help users visualize complex information more effectively, making the mapping process more intuitive and efficient.
Indeed, the integration of AI tools into concept mapping has been a topic of discussion for some time, highlighting their potential to refine and streamline the knowledge visualization process.
What Does a Concept Map Look Like Compared to a Mind Map?
While both concept maps and mind maps are visual tools for organizing information, they differ in structure and purpose.
What Are the Key Differences Between Concept Maps and Mind Maps?
Concept maps are typically more structured, with a focus on hierarchical relationships and cross-links between concepts. In contrast, mind maps are more free-form, often radiating from a central idea without strict organization. Concept maps emphasize the connections between ideas, while mind maps prioritize brainstorming and idea generation.
The distinction between various mapping tools, such as concept maps and mind maps, is crucial for effective knowledge organization, as further elaborated by research in the field.
What Are Examples of Concept Maps for Academic and Business Insights?
Visual examples of concept maps can provide valuable insights into their practical applications in various contexts.
Can You See Visual Examples of Hierarchical and Spider Concept Maps?
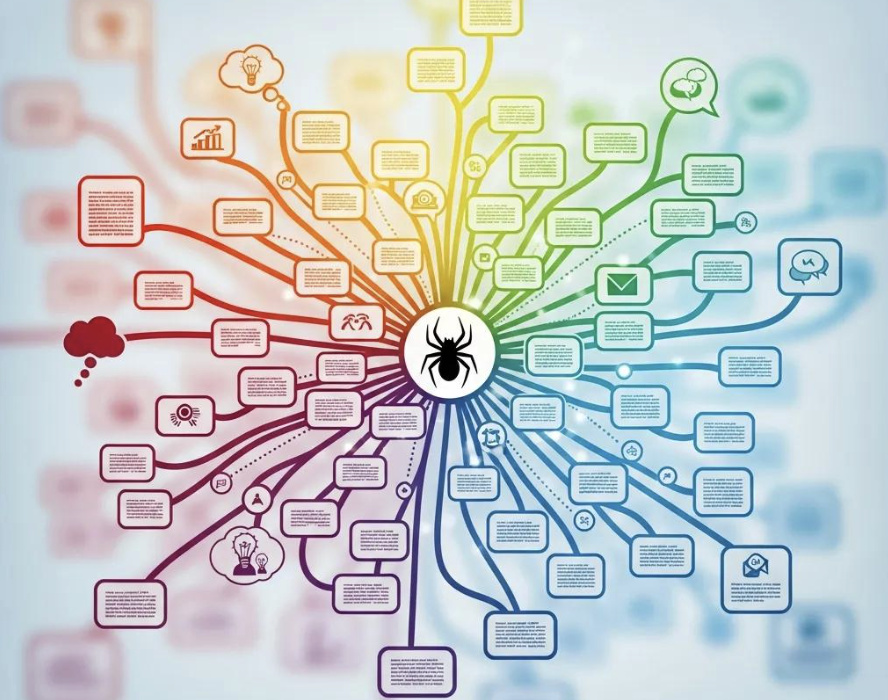
Hierarchical concept maps examples often depict educational curricula, while spider concept maps can illustrate brainstorming sessions around a central theme, such as "Sustainability." These visual representations help clarify relationships and enhance understanding.
How Do Concept Maps Facilitate Research Efficiency and Knowledge Retention?
Research has shown that using concept maps can improve knowledge retention by providing a visual framework for organizing information. This method allows learners to see connections between concepts, making it easier to recall information during exams or discussions.
Why Do Researchers and Deep Thinkers Prefer AI-Powered Concept Mapping?
AI-powered concept mapping tools offer several advantages that appeal to researchers and deep thinkers.
How Does AI-Driven Concept Mapping Support Deeper Thinking and Insight?
AI-driven tools enhance cognitive processes by providing insights into relationships between concepts that may not be immediately apparent. This support encourages deeper analysis and critical thinking, allowing users to explore complex ideas more thoroughly.
What Features Make Ponder’s Platform Ideal for Concept Mapping?
Ponder's platform offers features such as AI suggestions for connections, automated organization, and a flexible creative space for users to develop their ideas. These capabilities make it an ideal choice for anyone looking to create effective concept maps that facilitate learning and collaboration.
Ready to start visualizing your knowledge with advanced AI? You can easily create concept maps with AI and begin your journey with Ponder's intuitive concept mapping tools today.
For those looking to unlock the full potential of AI-powered concept mapping, explore the various subscription plans available. These plans are designed to cater to diverse needs, from individual projects to collaborative team environments.
Concept Map Type | Key Features | Best Use Case |
|---|---|---|
Top-down structure, clear relationships | Educational settings | |
Spider | Central concept with branching ideas | Brainstorming |
Flowchart | Sequential steps, arrows for flow | Business processes |
System | Interrelated components | Scientific research |
This table summarizes the different types of concept maps, highlighting their key features and best use cases, which can guide users in selecting the appropriate format for their needs.
To delve deeper into the world of concept mapping, AI, and knowledge visualization, visit our blog for expert articles, tutorials, and the latest updates.
See also: How to make a concept map | Types of mind maps | What is mind mapping used for
Frequently asked questions
What does a concept map look like and how is it structured?
A concept map has a distinctive visual structure: Nodes (oval or rectangular shapes) containing concept labels — usually single words or short phrases. Linking lines connecting related concepts, with linking phrases on the lines that explain the relationship (e.g., "causes," "is a type of," "includes," "leads to"). Hierarchical layout: more general, inclusive concepts at the top; more specific concepts at the bottom. Cross-links: lines connecting concepts from different parts of the hierarchy — these are often the most valuable part, showing non-obvious relationships. Unlike mind maps (which radiate from a center without labeled connections), concept maps have a top-down hierarchy and require explicit relationship labels on every link. This makes them more precise but also more structured and time-consuming to create.
What is the difference between a concept map and a mind map?
The core difference is structure and purpose: Mind map: radial structure (central topic with branches radiating outward), association-based, often uses images, typically created for personal brainstorming or note organization. Invented by Tony Buzan, emphasizes creativity and recall. Concept map: hierarchical network structure (general → specific), relationship-labeled links, cross-links showing complex connections. Developed by Joseph Novak for educational knowledge representation. Emphasizes precision and explicit relationship mapping. When to use each: mind maps for brainstorming, note-taking, and study — when you want to capture associations quickly. Concept maps for representing domain knowledge precisely, curriculum design, and research synthesis — when you need to show HOW concepts relate.
How do you create a good concept map?
Steps to create an effective concept map: (1) Focus question: start with a clear question the map will answer — "what causes climate change?" This prevents scope creep. (2) List concepts: brainstorm 15-25 key concepts related to the focus question. (3) Rank by generality: identify the most general, inclusive concepts (these go at the top) and the most specific examples (these go at the bottom). (4) Build the hierarchy: place the most general concept at the top; arrange others in a hierarchy from general to specific. (5) Add linking phrases: connect related concepts with labeled lines — the linking phrase is the most important part. (6) Add cross-links: connect concepts from different parts of the hierarchy that are also related. (7) Add examples: attach specific examples to the most abstract concepts. Tools: IHMC CmapTools (free, academic standard), Lucidchart, or Miro.
What are concept maps used for in education and research?
Concept maps have well-documented uses in education and research: Learning assessment: educators use concept maps to see how students understand relationships between concepts — structural errors reveal misconceptions that written answers don't surface. Curriculum design: teachers map the knowledge structure of a subject to design lesson sequences. Scientific knowledge representation: researchers in biology, medicine, and education use concept maps to represent and share complex knowledge structures. Literature synthesis: building a concept map of a research field makes the structure of existing knowledge visible — gaps, contradictions, and key variables become apparent. Pre-writing planning: mapping the relationships in your argument before writing helps identify gaps in your logic. For research synthesis: Ponder's research canvas connects concept nodes directly to the papers that establish them.
What is the difference between a concept map and a knowledge graph?
Concept maps and knowledge graphs are closely related but differ in formality and scale: Concept map: hand-crafted, small-to-medium scale (10-100 concepts), intended for human reading, created by domain experts or learners as a learning/communication tool. Relationship labels are informal natural language phrases ("is caused by," "is a type of"). Knowledge graph: machine-readable, potentially massive scale (millions of triples), formal ontological relationships, designed for querying and reasoning. Uses standardized relationship types (RDF, OWL). Examples: Google Knowledge Graph, Wikidata, DBpedia. A knowledge graph is essentially a formalized, machine-processable concept map. For researchers and educators, concept maps are the practical tool; knowledge graphs are for AI and information retrieval systems. Some tools (including Ponder's research canvas) offer an intermediate tier — structured-enough to support AI queries, accessible enough for researchers to build manually.
See also: Concept map examples · How to make a concept map · How to create a mind map