
AI data analysis: turn raw data into charts and a written report
An AI data analysis tool is software that checks, summarizes and tests a dataset to answer your question in plain words. Ponder, an AI research workspace, reads the data you attach, runs the statistics, draws journal-style charts and writes up the results.
A Ponder research case
Open the full caseTrusted by 400,000+ researchers in academia and industry











How it works
How to use AI for data analysis in Ponder
- Step 1
Attach data and state the goal
Attach an Excel, CSV, SPSS, Stata or SAS file and specify the variables and charts required.
- Step 2
Confirm the cleaning and the test
Ponder checks the data, lists the records it plans to exclude and confirms the appropriate test before running it.
- Step 3
Receive a traceable report
Charts and the report are saved to the project; the mark beside each statistic opens its data file, code and output.
What it does
What Ponder’s AI data analysis tool does
Reads Excel, CSV, SPSS, Stata and SAS files with their labels
Attach your data file in the box above and say what you want to learn. For SPSS, Stata and SAS files, Ponder also reads variable labels, value labels and missing-value definitions, so results say Male / Female rather than 1 / 2. Hand over existing SPSS, Stata, R, SAS or Python code and Ponder explains each step, then redoes it in Python.
- Excel and CSV
- SPSS (.sav)
- Stata (.dta)
- SAS
- Survey data
- Existing analysis code
Runs the statistical tests and reports them in APA style
Ponder writes and runs Python on your data for descriptive statistics, group comparisons and correlations. Each test comes with its assumption checks, an effect size and an APA-style results line, such as t(58) = 2.31, p = .024, d = 0.60, explained in plain words.
- Descriptive statistics
- t-test
- ANOVA
- Correlation
- Effect sizes
- Assumption checks
Draws journal-style charts for your manuscript
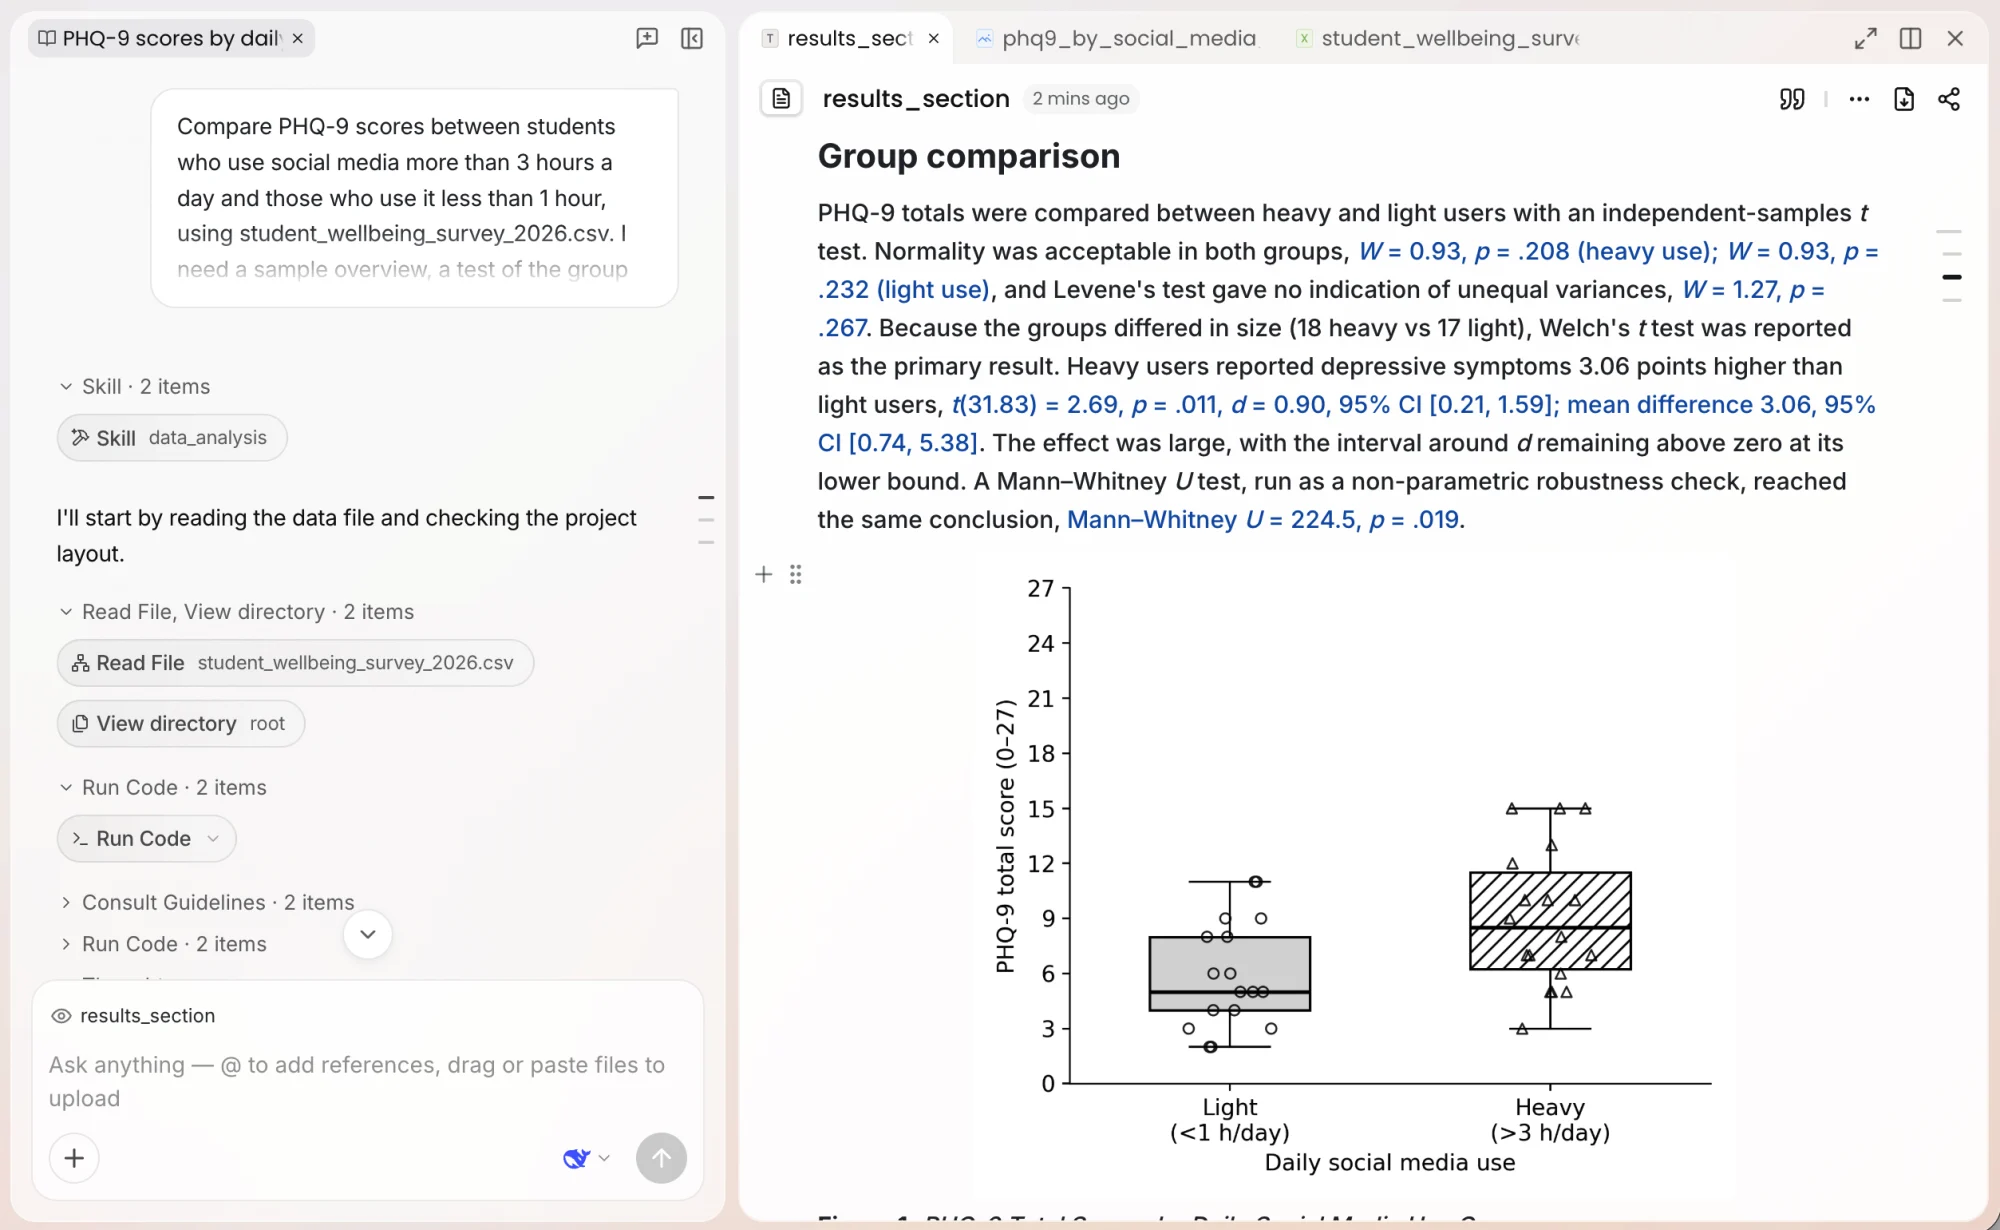
Charts are drawn on a white background, and each group gets its own fill pattern and marker, so groups stay distinguishable in black-and-white print. Each chart is saved to the project as an image, ready to insert into a document.
- Data visualization
- Box plots
- Scatter plots
- Figures for a paper
- Black-and-white print
Writes the analysis report and exports it to Word
Ask for a report and Ponder writes a document that covers the data analyzed, the cleaning steps, the methods, the assumption checks, the results tables, the charts and the conclusions. Charts also go into your own documents, and a finished document exports to Word.
- Analysis report
- Results section
- Thesis chapter
- Results tables
- Word export
Compare
Why use Ponder for AI data analysis
| SPSS, R or Excel by hand | General AI chatbot | Ponder | |
|---|---|---|---|
| Where the numbers come from | Syntax or formulas you write yourself | Code it runs on your file, where a code tool is available | Python code it writes and runs on your data |
| Checks before a test | You choose the test and run each check | When you ask for them | States the planned test and its assumptions, then runs it once you confirm |
| Charts | Built and styled by hand | Yes, as images in the chat | Journal-style charts saved to your project |
| Tracing a number in the report | Only if you kept the syntax and output | You copy results into the document yourself | A marker beside each statistic opens its data file, code and output |
| When the data changes | Rerun the analysis and retype the results | Upload again and ask again | Redoes the analysis and updates the report |
| Sign-up | A license or an install | Usually needed to upload files | Needed; free plan available |
Why you can rely on it
Open the analysis behind each result
- scholarly works searchable
- 320M+
- researchers use Ponder
- 400,000+
- countries where researchers use Ponder
- 120+
Statistics, results tables and charts that Ponder writes into a document carry a source marker. Open it to see the data file and its version, the code, the output and the package versions, so you can check a result before you report it.
How Ponder handles your dataQuestions
Learn more about AI data analysis and Ponder
What is an AI data analysis tool?
An AI data analysis tool is software that checks, summarizes and tests a dataset to answer your question in plain words. You say what you want to find out, and the tool handles the cleaning, the statistics and the charts, then explains what the results mean.
How do I use AI for data analysis?
Attach your data file in Ponder and state the goal, the variables and the groups to compare. Ponder checks the data, lists any records it plans to remove, confirms the test with you, then returns the results with charts. If you attach data without a request, Ponder reports an overview of the data first and asks what you want to analyze.
Can AI do statistical analysis?
Yes, provided the AI runs code on the data instead of estimating the numbers. Ponder writes and runs Python for descriptive statistics and inferential tests such as t-tests and ANOVA, and reports the assumption checks, the effect size and an APA-style results line for each test. Whether a method suits your research design is for you to judge, so name the method in your request when you need a particular one.
Which data files can Ponder analyze?
Ponder reads Excel, CSV, SPSS, Stata, SAS and JSON data files. For SPSS, Stata and SAS files it also reads variable labels, value labels and missing-value definitions, so results are shown by label rather than by code.
Can Ponder rerun my SPSS, Stata or R analysis?
Yes. Give Ponder the SPSS syntax, the Stata do-file, or an R, SAS or Python script or Jupyter notebook. Ponder sets out each step of the code in plain language, redoes the steps in Python in the same order, and explains how it matched any behavior that differs from the original software.
Can Ponder work as an AI data analyst?
Yes, for research data such as surveys and experiments. Ponder cleans the data, runs the statistics, draws the charts and writes the report, and it asks before removing a record or running an inferential test, so the decisions stay with you. When the data changes, ask Ponder to redo the analysis and it updates the numbers, tables and charts in the report.
Can ChatGPT do data analysis?
Yes. A general chatbot such as ChatGPT can run code on a file you upload and return statistics and charts. The results come back in the chat or as files to download, so bringing them into a manuscript and updating them when the data changes is usually manual work. Ponder saves the cleaned data, the charts and the report in your project, and the statistics in the report link back to the data file, code and output that produced them.
How do I check the results of an AI data analysis?
Read the code and the output behind each number. In Ponder, expand a Run Code card in the conversation to see the code, the files it used and the output. Your original file stays as it is: Ponder works on a copy and saves the cleaned data as a new file beside it.
Is Ponder’s AI data analysis free?
Yes. Ponder has a free plan you can use as soon as you sign up. Paid plans give you more usage.