
Analyze research data
Upload a data file and have Ponder clean it, run the statistics, draw the charts and write the results into a document.
You have survey or experimental data and need statistical results and charts you can put in a manuscript. Ponder writes and runs code to do the analysis, and the results, charts and cleaned data are all saved in your project.
What analyses you can run
Ponder writes and runs Python code in a separate, self-contained environment, so every statistical result is computed by code on your data. The work usually falls into four kinds.
- Checking and cleaning: Ponder works out which row holds the headers, how missing values are written and which numbers are stored as text, and finds invalid responses and duplicate records. Before removing any record, it lists the records it plans to remove and why, and removes them only once you agree.
- Descriptive statistics: sample size, means, standard deviations and group summaries.
- Inferential tests: tests of differences between groups and similar. Before running a test, Ponder explains the method it plans to use, why it suits this data, and what it will use instead if the assumptions are not met; it runs the test once you confirm. Results come with assumption checks, effect sizes and an APA-style results line, such as
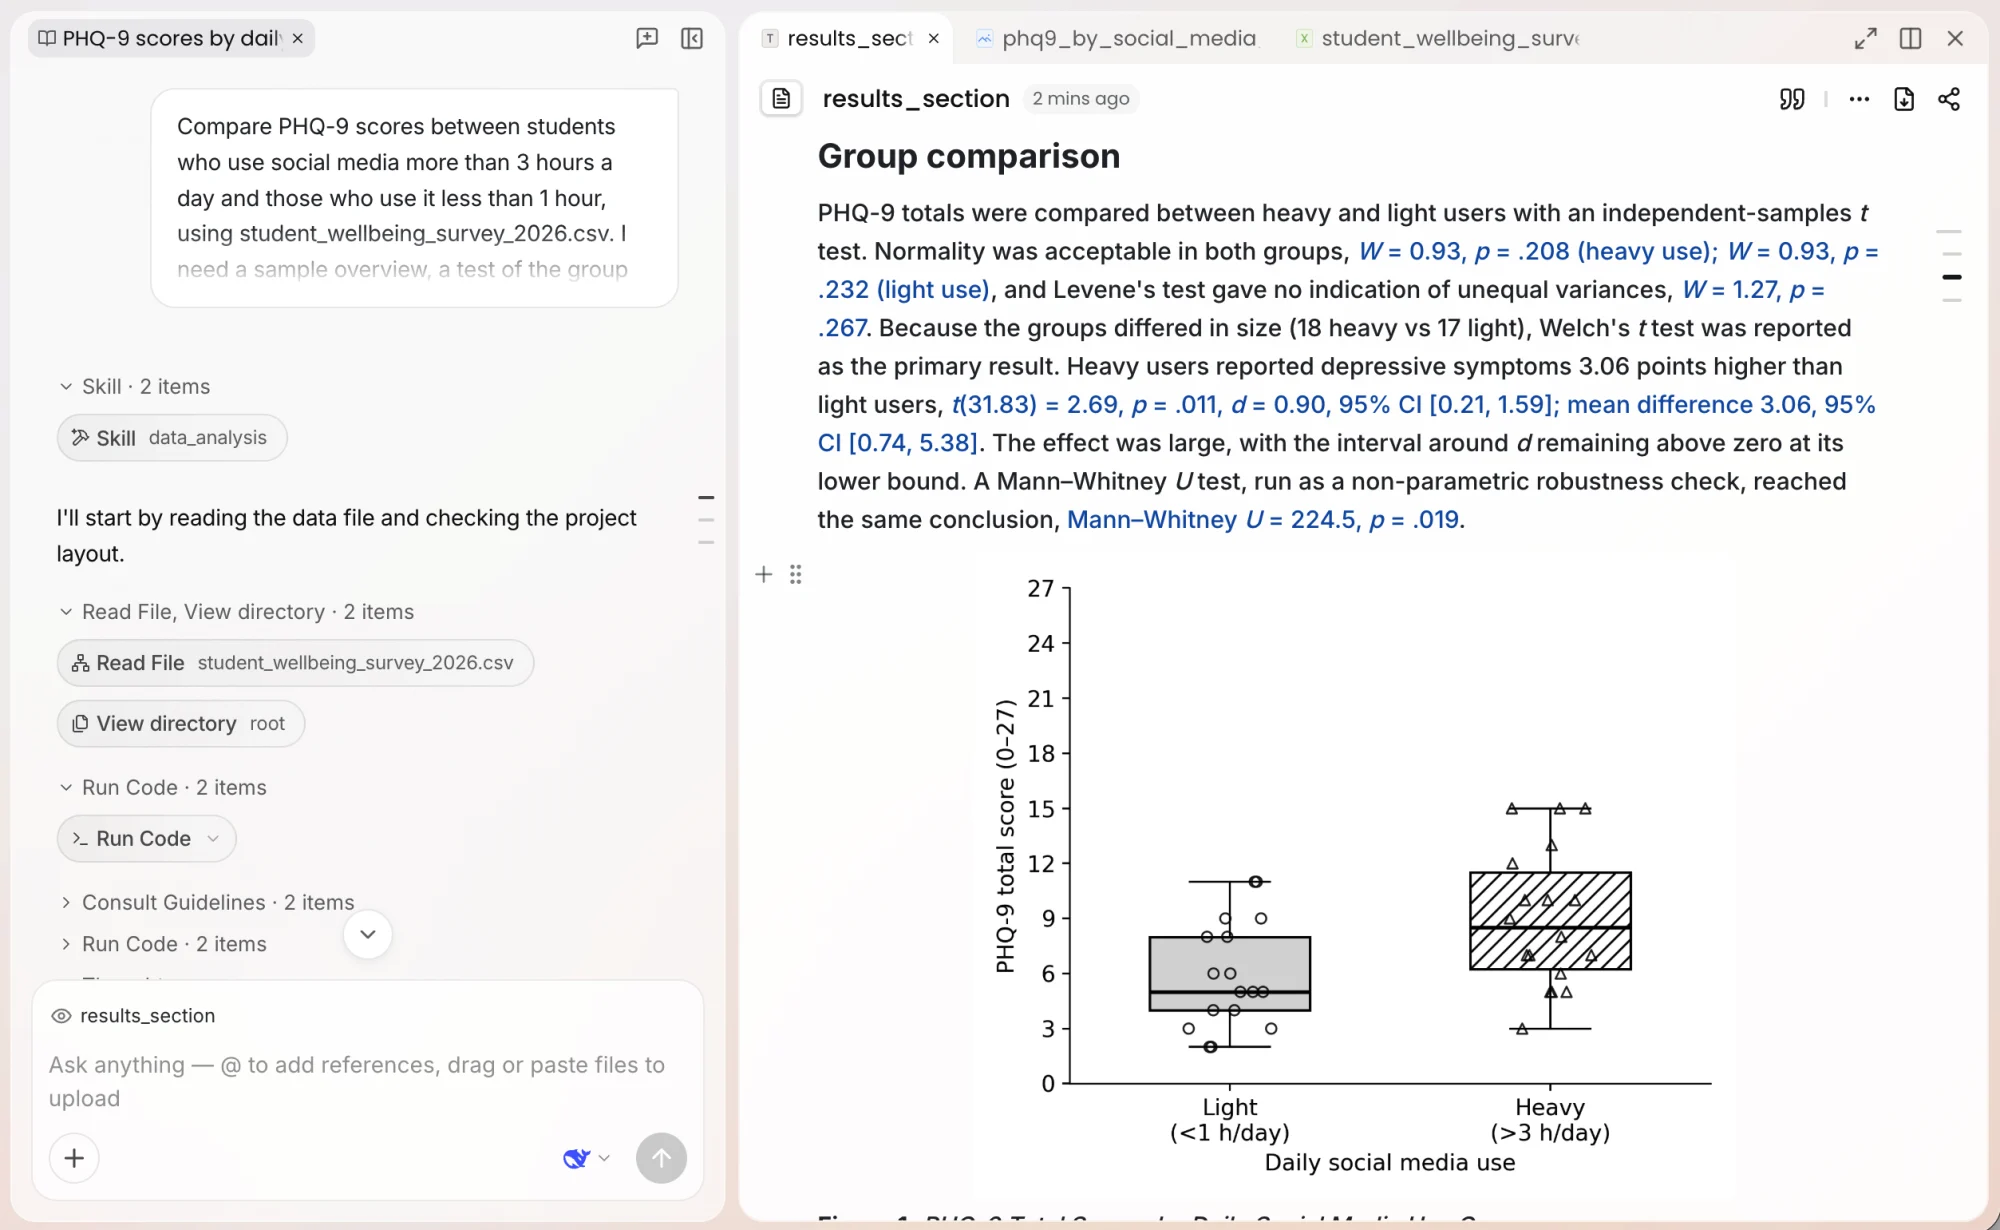
t(58) = 2.31, p = .024, d = 0.60. - Charts: journal-style charts on a white background, with groups that stay distinguishable when printed in black and white.
If you have already run an analysis in SPSS, Stata, R, SAS or Python, you can also give Ponder the code. It first sets out each step of the code in plain language, then redoes it in Python in the same order, and explains how it matched any behavior that differs from the original software.
Supported data and code formats
Ponder can read data files in formats including Excel, CSV, SPSS, Stata, SAS and JSON. For SPSS, Stata and SAS files it also reads variable labels, value labels and missing-value definitions, so results are shown by label: "Male / Female" rather than "1 / 2".
For code, Ponder can read Python, R, Stata, SPSS and SAS scripts, as well as Jupyter notebooks. For the full list of formats, see Import your sources.
Start a data analysis
First upload the data file to your project; see Import your sources for how. Then start from any of these places:
- Choose Analyze above the input box, click Data analysis, and write down what you want analyzed.
- Open a data file in the project and click Analyze; for a code file, click Explain.
- In any conversation, upload or @ a data file and write down what you want analyzed.
The results fit your research better when your request states the goal, the variables and the groups. For example: "Compare depression scale scores between students who use social media for more than 3 hours a day and those who use it for less than 1 hour." If you upload data without a request, Ponder first reports an overview of the data, then asks what you want to analyze.
How results are saved and checked
- Your original data stays as it is: Ponder works on a copy. The cleaned data is saved as a new file next to the original.
- Every version can be restored: later changes to the cleaned data are saved back to the same file as new versions. Open the file to view and restore any version.
- Charts are saved as project files: charts are stored in the project as images, ready to insert into a document at any time.
- Code and output are open to inspection: expand the Run Code card in the conversation to see the code Ponder ran, the files it used and the output, and check every number against it.
- Results in a document can be traced to their source: statistics, results tables and charts that Ponder writes into a document carry a source marker. Open it to see the data file and its version, the code, the output and the package versions, and click Back to session to open the conversation they came from. Numbers you have changed stay editable; where they differ from the computed result, the source lists the original value.
Whether a statistical method suits your research design is for you to judge. If you need a particular method, put it in your request, for example "Use Welch's t-test and report Cohen's d".
Redo an analysis after the data changes
When you add data or correct it, ask Ponder to redo the analysis with the new data, for example: "Redo the group comparison with the updated survey data and update the report." Ponder replaces the matching numbers, tables and charts in the document with the new results and rewrites the conclusion sentences they affect. Each change is listed in the AI edited this document comparison, where you can review and undo it.
If you would rather see the new results first and leave the document unchanged for now, say so in your request. The old results in the document are then flagged; open a result's source and click Use new value (Use new table for a table, Use new figure for a chart) to swap the new one in. If swapping it in would overwrite something you edited by hand, Ponder asks you to confirm first.
Write charts into a document and export it
When you need an analysis report, ask Ponder to write it up as a document. The report covers the data files analyzed, the cleaning steps, the methods, the assumption checks, the results tables, the charts and the conclusions.
You can also insert charts into your own documents. Drag the edge of an image to change its width, and use the toolbar at its top right to set alignment and add a caption. When the document is done, you can export it to Word; the exported file keeps only the content itself. If the document still has results that were redone but not yet swapped for the new values, you are reminded before exporting. For how to export, see Export your work.
What to read next
- Write your results into a manuscript: read Academic writing
- Export an analysis report: read Export your work
- Upload data files: read Import your sources